If you have any questions, please contact learningservices@ucs.ac.uk
Wednesday, 25 March 2015
Re-arranging an equation: making a variable the subject
We've just released a Getting Started Guide on how to re-arrange an equation. This complements materials we have in the Building Blocks Series.

Monday, 23 March 2015
Statistics Guide for Beginners: Maureen Haaker

If yes, the following resource was written by Maureen Haaker, a Lecturer in the Dept of Children, Young People and Education (Faculty of Arts, Business and Applied Social Science), and she has kindly shared it with us;
- Statistics Guide for Beginners (https://drive.google.com/file/d/0B8aF5QN3s_UDWm9IcGg4WHJoNGc/view)
With thanks - Image - http://support2.dundas.com/OnlineDocumentation/RSChart/images/Distribution_T.png
Sunday, 25 January 2015
Descriptive & Inferential Stats ... plus a few other things
This post is informed by a Level 5 Adult Nurse student who asked the question as an outcome of the module she is studying on Research for Practice (Qualitative Methods and Tools).
What is the difference between descriptive and inferential statistics?
Descriptive Stats: In more depth
This video gives some really useful background to the different types of data, based on examples, what tests you can perform based on the type of data, and how to apply it to your research or when reading research papers.
What is the difference between descriptive and inferential statistics?
Descriptive Stats: In more depth
This video gives some really useful background to the different types of data, based on examples, what tests you can perform based on the type of data, and how to apply it to your research or when reading research papers.
Monday, 5 January 2015
UEA Online Maths Support: A great starting place

The University of East Anglia's Learning Enhancement Team: Maths
Sunday, 7 December 2014
Monthly Video: Hypothesis Testing (small sample - t test)

The accepting or rejecting of a Null Hypothesis, often involves a T Test (where the sample is less than 30) or a Z Test (where the sample is greater than 30).
The following video walks through an illustration of what this means and how to complete a T Test. Although the software application often calculates the actual number, it is really useful for us to understand how it is calculated to help our interpretation. The following video is from the Khan Academy (https://www.khanacademy.org/).
If you have any questions, please email learningservices@ucs.ac.uk
Monday, 24 November 2014
Student Request: Converting a fraction into a decimal

If you have any questions around Maths Support, please email learningservices@ucs.ac.uk
Thanks - http://upload.wikimedia.org/wikipedia/commons/0/0b/Ybc7289-bw.jpg
Thursday, 20 November 2014
Monthly video: Interpreting p values
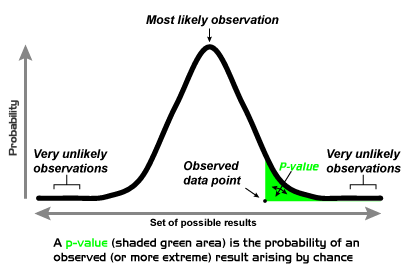
The following videos have been selected to answer the following questions;
- what is a p-value?
- when and where are thy used?
- what do they show?
Video 1:
Video 2: Looks at it from the perspective of the hypothesis
More YouTube explanations are available from: https://www.youtube.com/results?search_query=interpreting+p+values
If you have any questions, please email learningservices@ucs.ac.uk
If you are using Google Sheets, there is a template to allow you to calculate a Z and T Test, which produces the p values. For more information, see
Thanks - Image Source - http://upload.wikimedia.org/wikipedia/en/0/00/P-value_Graph.png
Subscribe to:
Posts (Atom)