Friday, 5 June 2015

Online Course (MOOC): Numeracy Skills for Employability and the Workplace

FutureLearn has just released a new course: Numeracy Skills for Employability and the Workplace. This aims to improve your mathematical confidence and gain the skills to pass employers’ numeracy tests with this free online course.

This free online course from the Mathematics Education Centre at Loughborough University will help you improve or revise your knowledge of mathematics. You will gain the numeracy skills needed to succeed in both employers’ numeracy tests and the workplace. It is designed to build your confidence. Over three weeks, we will look at where numbers occur in everyday life and what numeracy means in this context. We will look at the rationale behind employers’ numeracy testing and the skills you will need to be successful. In addition to refreshing your understanding of specific numeracy skills (such as percentages, ratios, averages and currency conversions), you will develop essential skills for interpreting numerical data and understanding statistics.

For more information, and to enrol, visit:


Disclaimer

This online course is not designed or delivered by members of Learning Services, therefore, we can take no responsibility for the content.

With thanks - Image - http://img2.findthebest.com/sites/default/files/3094/media/images/t2/FutureLearn_823185.png

Friday, 15 May 2015

Usage Stats: Learning Services Maths Support

Given we are nearing the end of the academic year, I thought it would be useful to publish the log data for the Learning Services Maths Support Resource.

As you maybe aware, this site was developed as part of our changing support model for Maths at UCS. The new support model more clearly identifies the responsibilities between Learning Services and the Course Teams / Lecturers.

The aim of this resource is to provide a repository for discipline and/or task specific how to guides (both created in house, or sourced from Khan Academy and HEIs), provide a gateway to available online courses (either created in house, or via MOOC platforms), and link to quality assured resources created by similar teams in other UK HEIs.

Please note, as a new resource there is no comparable data. However, the following is very interesting as it highlights a number of key observations. Firstly, the resource is being used, secondly the majority of visitors are finding this resource via Google and not through our internal promotion, and thirdly, nearly half the accesses are from outside the UK.

  • Page views (September 2014 to May 2015): 2,207
  • Total number of posts (September 2014 to May 2015): 13
  • Traffic Source: Google
  • Audience: 53.5% from UK, 21.9% from USA

Publication Pattern of Posts

The intention was to post a minimum of two posts per month. It is evident this was achieved for the majority of time.

  • Sept 2014: 2
  • Oct 2014: 2
  • Nov 2014: 4
  • Dec 2014: 1
  • Jan 2015: 2
  • Feb 2015: 0
  • March 2015: 2
  • April 2105: 0

Most popular posts

  • Monthly video: Hypothesis Testing: 364 page views (16.5 of total page views)

Most popular pages

The following pattern supports the opinion within Learning Services we need to improve the impact of the Building Blocks page, which we view as text heavy and static. We are in the process of creating a number of getting started video guides, and exploring an ask a question option.

  • Building Blocks: 274 page views
  • Health & Science: 121 page views
  • Getting Support: 86 page views
  • Online Courses: 62 page views
  • Dissertations: 54 page views
  • Arts, Business & ASS: 41 page views

If you have any questions around this post or Maths Support at UCS, please email Learning Services (learningservices@ucs.ac.uk).

Image - With thanks - free to share

  • http://upload.wikimedia.org/wikipedia/commons/9/9b/Social_Network_Analysis_Visualization.png


Wednesday, 25 March 2015

Re-arranging an equation: making a variable the subject

We've just released a Getting Started Guide on how to re-arrange an equation. This complements materials we have in the Building Blocks Series.

If you have any questions, please contact learningservices@ucs.ac.uk


Monday, 23 March 2015

Statistics Guide for Beginners: Maureen Haaker

Are you looking for help around statistics?

If yes, the following resource was written by Maureen Haaker, a Lecturer in the Dept of Children, Young People and Education (Faculty of Arts, Business and Applied Social Science), and she has kindly shared it with us;


With thanks - Image - http://support2.dundas.com/OnlineDocumentation/RSChart/images/Distribution_T.png 

Sunday, 25 January 2015

Descriptive & Inferential Stats ... plus a few other things

This post is informed by a Level 5 Adult Nurse student who asked the question as an outcome of the module she is studying on Research for Practice (Qualitative Methods and Tools).

What is the difference between descriptive and inferential statistics?

Descriptive Stats: In more depth

This video gives some really useful background to the different types of data, based on examples, what tests you can perform based on the type of data, and how to apply it to your research or when reading research papers.

Monday, 5 January 2015

UEA Online Maths Support: A great starting place

Increasingly, people are using the Internet and YouTube to help them with their Maths. We'd strongly encourage this move as there is a wealth of information available. Therefore, to help you get to navigate this wealth of knowledge, we are recommending a good starting point for your journey is the following source. The reason being it offers excellent coverage, it is easy to navigate to the information areas, and the majority of the guides are available as videos.

The University of East Anglia's Learning Enhancement Team: Maths

Sunday, 7 December 2014

Monthly Video: Hypothesis Testing (small sample - t test)

A requirement is the use of statistics to help us either accept or reject a hypothesis (A hypothesis is a proposed explanation for a phenomenon. For a hypothesis to be a scientific hypothesis, the scientific method requires that one can test it. Wikipedia, http://en.wikipedia.org/wiki/Hypothesis).

The accepting or rejecting of a Null Hypothesis, often involves a T Test (where the sample is less than 30) or a Z Test (where the sample is greater than 30).

The following video walks through an illustration of what this means and how to complete a T Test. Although the software application often calculates the actual number, it is really useful for us to understand how it is calculated to help our interpretation. The following video is from the Khan Academy (https://www.khanacademy.org/).


If you have any questions, please email learningservices@ucs.ac.uk

Monday, 24 November 2014

Student Request: Converting a fraction into a decimal

In response to a session I ran the other day, I thought the following Khan Academy video would be really useful for those who are looking at refreshing on how to convert a fraction into a decimal. It is also really useful as it explains how to convert a decimal into a fraction :-)

If you have any questions around Maths Support, please email learningservices@ucs.ac.uk


Thanks - http://upload.wikimedia.org/wikipedia/commons/0/0b/Ybc7289-bw.jpg

Thursday, 20 November 2014

Monthly video: Interpreting p values

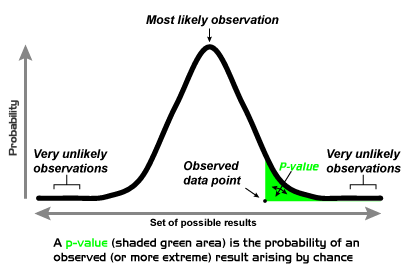
Currently, one of the most frequent requests we receive is around, "what is a p value? what does it mean?".

The following videos have been selected to answer the following questions; 
  1. what is a p-value?
  2. when and where are thy used?
  3. what do they show?
The videos use lots of terminology, a key one to remember, is "Null hypothesis, refers to a general statement or default position that there is no relationship between two measured phenomena." If we reject the Null hypothesis, (indicated by a low p-value) we can accept the alternate hypothesis"

Video 1:


Video 2: Looks at it from the perspective of the hypothesis


More YouTube explanations are available from: https://www.youtube.com/results?search_query=interpreting+p+values 

If you have any questions, please email learningservices@ucs.ac.uk

If you are using Google Sheets, there is a template to allow you to calculate a Z and T Test, which produces the p values. For more information, see

Thanks - Image Source - http://upload.wikimedia.org/wikipedia/en/0/00/P-value_Graph.png

Wednesday, 19 November 2014

Student request: Find the equation of a line with a certain gradient which passes through a specific point

We've had a few requests from students around how to find the equation of a line which passes through a specific point, and has a certain slope (gradient), within the Faculty of Health and Science, Dept of Science and Technology.

For example, their practical problems (Basic Algebra 4), sheet includes 9 questions. The following video walks through one method which is nice and straight forward.

If you've been struggling with your approach, perhaps the following will help. The equation you need to provide is slope-intercept equation which is calculated at the end of the video.


If you have any questions, please contact Learning Services (learningservices@ucs.ac.uk)

Monday, 17 November 2014

Student request: Help solving simultaneous equations

We've had a few requests from students around how to solve simultaneous numbers, within the Faculty of Health and Science, Dept of Science and Technology.

For example, their practical problems (Basic Algebra 3), sheet includes 30 questions. The following video walks through one method which is nice and straight forward. If you've been struggling with your approach, perhaps the following will help.


If you have any questions, please contact Learning Services (learningservices@ucs.ac.uk)

Wednesday, 29 October 2014

Monthly Video Series: Descriptive Statistics

As part of the dissemination and awareness process we'll be sharing videos from external sources.
The following video is from the Khan Academy, and walks through how to calculate a number of descriptive statistics; mean, mode, median.

These measure averages and are regularly used as the starting point in understanding the dataset.


As the data set becomes larger, and more complex calculating by hand becomes more problematic (and prone to errors). Therefore, you can calculate the descriptive statistics using a spreadsheet. The following (silent) video walks through how to calculate a number of different descriptive statistics using Google Spreadsheets.


If you have any questions, please contact Learning Services (learningservices@ucs.ac.uk)

Tuesday, 28 October 2014

Book Review: Practical Statistics for Nursing and Health Care

As part of our support to course teams I've been working with Karen Lewis to explore what textbooks are available in the Library which map to the topics she'll be covering in her sessions. The intention is to discipline specific texts to help students connect with the topic, as opposed to general statistics books which might seem a little abstract. A textbook which is really good for Nursing and Health Care is;

Practical statistics for nursing and health care (stsk 519.502461 FOW)

This maps to her curriculum very neatly. For instance;


  • Processing data (Scales of measurement, nominal, ordinal, interval) is in Chapter 3
  • Measuring the Average (mean, mode, median) is Chapter 7
  • Measuring variability (range, standard deviation, alternatives and interpretations) is Chapter 8
  • Measuring Correlations (meaning, strength, significance and calculation) is Chapter 13

Tuesday, 16 September 2014

Learning Services Resources for Maths Support

We'd just like to make you aware we have a large number of Maths support books which are available in the Library. These have been purchased to support the needs from across the various course teams, and account for difference starting points.

The book collection has been located with other academic skills resources, and are based in the PC Suite, near L107.

We'd encourage you to use these books as part of your self directed support. So once your lecturers have introduced and applied the maths, please pop across to the Library to access these resources.

Thursday, 11 September 2014

Monthly Video Series: Correlation

As part of the dissemination and awareness process we'll be sharing videos from external sources. To start the process I've selected the Statistics 101 Course on YouTube, by Brandon Foltz (https://www.youtube.com/user/BCFoltz/videos). He regularly publishes videos around statistical techniques. I'll admit, these are more directed towards the final year / dissertation students.

The following video explores the concept of correlation. Given it is part of a series, the start makes reference to the previous video. Therefore, I'd suggest, sit back, relax and give it time.


Correlation is a very useful statistical test for exploring two data sets which have no causal relationship. Excel (and Google Spreadsheet) includes an inbuilt function for calculating correlation coefficient. The following video outlines how this is done.