A requirement is the use of statistics to help us either accept or reject a hypothesis (A hypothesis is a proposed explanation for a phenomenon. For a hypothesis to be a scientific hypothesis, the scientific method requires that one can test it. Wikipedia, http://en.wikipedia.org/wiki/Hypothesis).
The accepting or rejecting of a Null Hypothesis, often involves a T Test (where the sample is less than 30) or a Z Test (where the sample is greater than 30).
The following video walks through an illustration of what this means and how to complete a T Test. Although the software application often calculates the actual number, it is really useful for us to understand how it is calculated to help our interpretation. The following video is from the Khan Academy (https://www.khanacademy.org/).
If you have any questions, please email learningservices@ucs.ac.uk
Showing posts with label monthly video. Show all posts
Showing posts with label monthly video. Show all posts
Sunday, 7 December 2014
Thursday, 20 November 2014
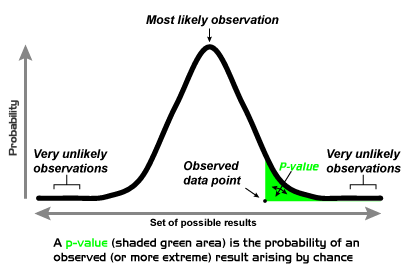
Monthly video: Interpreting p values
Currently, one of the most frequent requests we receive is around, "what is a p value? what does it mean?".
Video 1:
Video 2: Looks at it from the perspective of the hypothesis
More YouTube explanations are available from: https://www.youtube.com/results?search_query=interpreting+p+values
The following videos have been selected to answer the following questions;
- what is a p-value?
- when and where are thy used?
- what do they show?
Video 1:
Video 2: Looks at it from the perspective of the hypothesis
More YouTube explanations are available from: https://www.youtube.com/results?search_query=interpreting+p+values
If you have any questions, please email learningservices@ucs.ac.uk
If you are using Google Sheets, there is a template to allow you to calculate a Z and T Test, which produces the p values. For more information, see
Thanks - Image Source - http://upload.wikimedia.org/wikipedia/en/0/00/P-value_Graph.png
Wednesday, 29 October 2014
Monthly Video Series: Descriptive Statistics
As part of the dissemination and awareness process we'll be sharing videos from external sources.
The following video is from the Khan Academy, and walks through how to calculate a number of descriptive statistics; mean, mode, median.
These measure averages and are regularly used as the starting point in understanding the dataset.
As the data set becomes larger, and more complex calculating by hand becomes more problematic (and prone to errors). Therefore, you can calculate the descriptive statistics using a spreadsheet. The following (silent) video walks through how to calculate a number of different descriptive statistics using Google Spreadsheets.
If you have any questions, please contact Learning Services (learningservices@ucs.ac.uk)
Thursday, 11 September 2014
Monthly Video Series: Correlation
As part of the dissemination and awareness process we'll be sharing videos from external sources. To start the process I've selected the Statistics 101 Course on YouTube, by Brandon Foltz (https://www.youtube.com/user/BCFoltz/videos). He regularly publishes videos around statistical techniques. I'll admit, these are more directed towards the final year / dissertation students.
The following video explores the concept of correlation. Given it is part of a series, the start makes reference to the previous video. Therefore, I'd suggest, sit back, relax and give it time.
Correlation is a very useful statistical test for exploring two data sets which have no causal relationship. Excel (and Google Spreadsheet) includes an inbuilt function for calculating correlation coefficient. The following video outlines how this is done.
Subscribe to:
Posts (Atom)

